 Français (France)
 English (UK)
 English (US)
 Deutsch (Deutschland)

Contents
‘220 minus age’: where the formula comes from, and what it is worth
180. That is the maximum number of beats per minute that ‘220 minus age’ predicts for a 40-year-old runner, and the figure on which plenty of training zones are built. Now do the sum on the error: the standard error of this formula runs from 7 to 11 beats per minute [1] [2]. Our 40-year-old’s true maximum therefore sits somewhere between 170 and 190, and for roughly one runner in three it lands even further away.
The formula is everywhere all the same. The American Heart Association repeats it, with the caveat that its figures are averages to be taken as a general guide [3]. Its history is shakier than its popularity: in 2002, the physiologists Robert Robergs and Roberto Landwehr traced it back and concluded that it comes from no study, but from observations drawn from about ten references, several of which cite a 1971 text by Fox and Haskell as its origin [1]. Their verdict: it has no scientific basis in exercise physiology. A 2024 review adds that it comes from a group of middle-aged men averaging 55 years old, which explains why it overestimates the maximum of young adults and underestimates it after 40 [4].
Tanaka, Gellish, Nes: closer to the mark, never exact
Several teams have redone the sum using real measurements. Hirofumi Tanaka and his colleagues gathered 351 studies, covering 18,712 people, and arrived at 208 − 0.7 × age, which their laboratory test on 514 healthy adults confirmed (209 − 0.7 × age); the line depends neither on sex nor on activity level [5]. Ralph Gellish followed 132 adults whose 908 maximal exercise tests span 25 years: 207 − 0.7 × age [6]. The Norwegian HUNT study, on 3,320 healthy adults, gives 211 − 0.64 × age, with a standard error of 10.8 beats [2].
| Formula | Source | What it rests on | Worth knowing |
|---|---|---|---|
| 220 − age | Fox and Haskell, 1971, as reported by Robergs and Landwehr | About ten references compiled | Standard error of 7 to 11 bpm |
| 208 − 0.7 × age | Tanaka et al., 2001 | 351 studies, 18,712 people | Confirmed on 514 adults in the laboratory |
| 207 − 0.7 × age | Gellish et al., 2007 | 132 adults followed, 908 tests over 25 years | Same people measured several times |
| 211 − 0.64 × age | Nes et al., 2013 | 3,320 healthy adults | Standard error of 10.8 bpm |
Standard errors are the authors’ own. bpm: beats per minute.
At 40, the four formulas give 180, 180, 179 and 185: the gap between them is smaller than the error of any one of them. At 60 it reaches 13 beats (160 against 173), because 220 − age falls faster than the others. The American coach Joe Friel, whose zone methods TrainingPeaks publishes, goes further: in his view, 220 minus age is as likely to be wrong as right [7].
The five zones on a watch: what they mean
Your watch splits effort into five numbered zones. On Garmin, by default, they cover 50 to 100% of the maximum in steps of 10%, and the brand describes each zone by how it feels [8]. For a maximum of 180 beats, that gives:
| Zone | Share of maximum | For 180 bpm | How it feels, according to Garmin |
|---|---|---|---|
| 1 | 50 to 60% | 90 to 108 | Relaxed pace, easy conversation |
| 2 | 60 to 70% | 108 to 126 | Deeper breathing, conversation still possible |
| 3 | 70 to 80% | 126 to 144 | Conversation hard to keep up |
| 4 | 80 to 90% | 144 to 162 | Sustainable but uncomfortable pace, heavy breathing |
| 5 | 90 to 100% | 162 to 180 | Sustainable for a short time, laboured breathing |
Percentages and descriptions from Garmin’s blog; bounds in bpm calculated for the example. Other brands and other grids split things differently.
Not every grid looks alike. The American Heart Association talks of 50 to 70% of the maximum for moderate effort and 70 to 85% for vigorous effort [3]. The talk test costs nothing and bears those figures out: at moderate intensity you can talk but not sing, while at high intensity you can say only a few words without pausing for breath, sums up the US CDC [9]. The NHS gives the same markers: at moderate intensity you can talk but not sing the words of a song, and at high intensity you cannot say more than a few words without pausing for breath [10].
Why spend time in the low zones? In a review of top endurance athletes, the physiologist Stephen Seiler notes that about 80% of sessions are done at low intensity (blood lactate of about 2 mmol/L at most) and about 20% at high intensity, around 90% of The maximum rate at which the body can use oxygen during effort. [11]. These athletes train 10 to 13 times a week: for the rest of us, I take the proportion from it, not the volume.
The Karvonen method: start from the reserve, not the maximum
The Karvonen method works out the zones from the The gap between maximum heart rate and resting heart rate: the margin the heart has to speed up., that is, the maximum minus the resting rate [12]. It is named after the Finnish physiologist Martti Karvonen, whose 1957 study of how training affects heart rate gave the method its name [13].
Take our 40-year-old, with 180 beats at the maximum and 55 at rest: the reserve is 125. Zone 2, at 60 to 70% of the reserve, runs from 55 + 75 = 130 to 55 + 87.5 ≈ 143 beats. Apply the same percentages to the maximum and the same zone runs from 108 to 126. Between the two methods the figure shifts by 17 to 22 beats, without the runner having changed.
The algebra explains the shift: the bound equals percentage × maximum + (1 − percentage) × resting. Resting therefore carries 40% of the result for the 60% bound and 10% for the 90% bound, then nothing at 100%. To measure it, the American Heart Association advises taking your pulse in the morning, after a good night’s sleep, before getting up [3]; Garmin watches also let you enter a personalised resting rate and choose between zones in bpm, % of maximum, % of reserve or % of threshold [12].
The threshold method: set your zones from a 30-minute test
The third method is Joe Friel’s: start from the The intensity above which the body produces more lactate than it clears; the heart rate at that point is called lactate threshold heart rate, LTHR., rather than from the maximum [7]. The test comes down to four steps:
- Warm up, then run for 30 minutes on your own, as if racing, as hard as you can sustain for the whole time, without setting off too fast.
- Press the watch’s lap button at the 10th minute.
- At the end, read your average heart rate for the last 20 minutes: it is an approximation of your threshold heart rate.
- Enter it in your watch: Garmin lets you set this value, or lets the watch detect it during a run [12].
Friel warns that most people start too fast, then slow down, which skews the result; the test gets better with repetition [7]. His running zones are then calculated as a percentage of that threshold. For a threshold of 165 beats:
| Zone | Share of threshold | For 165 bpm |
|---|---|---|
| 1 | Under 85% | Under 140 |
| 2 | 85 to 89% | 140 to 147 |
| 3 | 90 to 94% | 149 to 155 |
| 4 | 95 to 99% | 157 to 163 |
| 5a | 100 to 102% | 165 to 168 |
| 5b | 103 to 106% | 170 to 175 |
| 5c | Over 106% | Over 175 |
Percentages from Joe Friel (TrainingPeaks); bounds in bpm rounded to the nearest unit. Threshold of 165 bpm taken for the example.
On the trail: what the watch does not tell you
On a trail, the pulse does not behave as it does on a track, and three things will skew your zones if you ignore them.
The lag. At the foot of a climb, heart rate takes a while to catch up with the effort: a watch that still shows zone 2 when you are already out of breath is not broken. On a profile that strings climbs and descents together, the average per zone quickly blurs. The km-effort helps to compare races, not to set a pulse.

The drift. After 10 to 20 minutes of continuous effort, the volume of blood pumped with each beat gradually falls, and heart rate rises to compensate: this is cardiovascular drift [15]. On a long run, the pulse therefore climbs at a constant pace. Temperature, medication and state of health matter too, notes the Deutsche Herzstiftung [14].
The descent. The heart slows down there, but the thighs take a pounding: the zone says nothing about muscle wear. The first trail training plan doses these efforts without relying on the pulse.
My advice: on a steep climb, walking briskly beats running in zone 4, and the pulse should be read over a steady minute rather than at a single instant. Garmin also points out that you get more from zones with a dedicated heart rate sensor [8]. For the whole subject, the beginner’s guide to trail running remains the starting point.
Which method should you choose?
| Your situation | Method | What you need | Its limit |
|---|---|---|---|
| You are starting out, with no figures of your own | Percentage of maximum, with Tanaka or Nes | Your age | Standard error of 7 to 11 bpm on the maximum |
| You know your maximum and your resting rate | Karvonen reserve | Maximum and resting rate measured in the morning | A wrong maximum gives wrong zones |
| You can face a hard 30-minute effort | Friel’s threshold | A heart rate watch and a solo test | Demanding effort, to be repeated |
| No watch, or heart medication | Talk test, with your doctor’s advice | Nothing | Less precise, but always available |
Worked examples in the article: age 40, 180 bpm at maximum, 55 at rest, threshold at 165 bpm.
Whichever method you use, stick with it for a few weeks before judging it: changing the settings on every run makes the zones unreadable. And keep in mind the limit common to all of them: a zone is a convention, not a measurement of your body.
A zone is a range of sensations before it is a number: if the watch and your breathing disagree, believe your breathing and correct the watch.
Kit related to this article
No affiliation: no commission, no sponsored products.
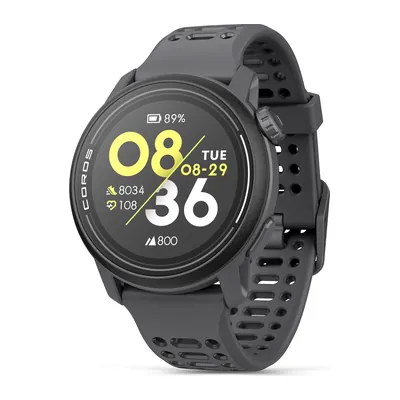
COROS PACE 3
A 30 g GPS watch with a barometric altimeter: it records the distance and the climb of every run, enough to track your progress and your km-effort.
View on Amazon (opens in a new tab)
Worth watching
Compares several ways to estimate maximum heart rate, including 220 minus age, the Tanaka formula and the Nes formula, and covers the limits of the classic rule.

The video is hosted by YouTube (Google): nothing loads until you play it, and Google may then set cookies.
FAQs
How do you calculate your maximum heart rate?
Without a measurement, a formula gives a starting point: 208 − 0.7 × age (Tanaka) gives 180 beats per minute at 40, and 211 − 0.64 × age (Nes) gives 185. The standard error of these formulas is 7 to 11 beats: the true maximum is measured with a stress test at a sports doctor’s.
What is the difference between zones as a percentage of maximum and the Karvonen method?
The first applies the percentages to the maximum; the second applies them to the reserve (maximum minus resting) and then adds the resting rate back. For a maximum of 180 and a resting rate of 55, zone 2 runs from 108 to 126 beats with the first and from 130 to 143 with the second. Neither is ‘the right one’: they are two conventions.
Do you need a chest strap to train by zones in trail running?
It is not compulsory: the talk test, mentioned by the CDC and the NHS, is enough to tell moderate effort from vigorous effort. Garmin does say you get more from zones with a dedicated heart rate sensor, especially when the pulse changes quickly, on climbs or in intervals.
Why does my pulse rise when my pace has not changed?
After 10 to 20 minutes of continuous effort, the volume of blood pumped with each beat gradually falls and heart rate rises to compensate: this is cardiovascular drift. Heat, some medications and state of health add to it. On a long run, a slow rise in pulse is therefore normal.
How much time should you spend in zone 2?
The top endurance athletes studied by Stephen Seiler do about 80% of their sessions at low intensity and 20% at high intensity, training 10 to 13 times a week. For an amateur runner, it is the proportion that counts, not the volume: most of your runs should stay easy.
Do these calculations apply with a heart medication?
No. A beta blocker, for example, makes the pulse rise little or slowly, and heart disease changes the limits: the maximum and training heart rate are set with your doctor, often with a stress test. The Deutsche Herzstiftung and the American Heart Association give the same advice.
Sources
- Robert A. Robergs and Roberto Landwehr, ‘The surprising history of the HRmax=220-age equation’, Journal of Exercise Physiology online, 2002, 5(2), pp. 1-10, accessed 1 November 2026. asep.org https://www.asep.org/asep/asep/Robergs2.pdf ↩
- Bjarne M. Nes et al., ‘Age-predicted maximal heart rate in healthy subjects: The HUNT Fitness Study’, Scandinavian Journal of Medicine & Science in Sports, 2013, 23(6), pp. 697-704, accessed 1 November 2026. pubmed.ncbi.nlm.nih.gov https://pubmed.ncbi.nlm.nih.gov/22376273/ ↩
- American Heart Association, ‘Target Heart Rates Chart’, last reviewed 12 August 2024, accessed 1 November 2026. heart.org https://www.heart.org/en/healthy-living/exercise-and-physical-activity/fitness-basics/target-heart-rates ↩
- Omar Almaadawy, Barry F. Uretsky and Chayakrit Krittanawong, ‘Target Heart Rate Formulas for Exercise Stress Testing: What Is the Evidence?’, Journal of Clinical Medicine, 2024, accessed 1 November 2026. pmc.ncbi.nlm.nih.gov https://pmc.ncbi.nlm.nih.gov/articles/PMC11432587/ ↩
- Hirofumi Tanaka, Kevin D. Monahan and Douglas R. Seals, ‘Age-predicted maximal heart rate revisited’, Journal of the American College of Cardiology, 2001, 37(1), pp. 153-156, accessed 1 November 2026. pubmed.ncbi.nlm.nih.gov https://pubmed.ncbi.nlm.nih.gov/11153730/ ↩
- Ralph L. Gellish et al., ‘Longitudinal modeling of the relationship between age and maximal heart rate’, Medicine and Science in Sports and Exercise, 2007, 39(5), pp. 822-829, accessed 1 November 2026. pubmed.ncbi.nlm.nih.gov https://pubmed.ncbi.nlm.nih.gov/17468581/ ↩
- Joe Friel, ‘Joe Friel’s Quick Guide to Setting Zones’, TrainingPeaks, accessed 1 November 2026. trainingpeaks.com https://www.trainingpeaks.com/learn/articles/joe-friel-s-quick-guide-to-setting-zones/ ↩
- Garmin, ‘How you can train by heart rate zones using Garmin’, Garmin blog, accessed 1 November 2026. garmin.com https://www.garmin.com/en-US/blog/fitness/how-you-can-train-by-heart-rate-zones-using-garmin/ ↩
- Centers for Disease Control and Prevention, ‘How to Measure Physical Activity Intensity’, 4 December 2025, accessed 1 November 2026. cdc.gov https://www.cdc.gov/physical-activity-basics/measuring/index.html ↩
- NHS, ‘Benefits of exercise’, accessed 1 November 2026. nhs.uk https://www.nhs.uk/live-well/exercise/exercise-health-benefits/ ↩
- Stephen Seiler, ‘What is best practice for training intensity and duration distribution in endurance athletes?’, International Journal of Sports Physiology and Performance, 2010, 5(3), pp. 276-291, accessed 1 November 2026. pubmed.ncbi.nlm.nih.gov https://pubmed.ncbi.nlm.nih.gov/20861519/ ↩
- Garmin, fēnix 7 owner’s manual, ‘Setting Your Heart Rate Zones’, accessed 1 November 2026. www8.garmin.com https://www8.garmin.com/manuals/webhelp/GUID-C001C335-A8EC-4A41-AB0E-BAC434259F92/EN-US/GUID-30C91919-943C-44E9-8048-901AC0881AEA.html ↩
- Martti J. Karvonen, Eino Kentala and Olavi Mustala, ‘The effects of training on heart rate; a longitudinal study’, Annales Medicinae Experimentalis et Biologiae Fenniae, 1957, 35(3), pp. 307-315, accessed 1 November 2026. pubmed.ncbi.nlm.nih.gov https://pubmed.ncbi.nlm.nih.gov/13470504/ ↩
- Deutsche Herzstiftung, ‘Welcher Puls ist normal?’, updated 23 October 2026, accessed 1 November 2026 (in German). herzstiftung.de https://herzstiftung.de/ihre-herzgesundheit/anzeichen-fuer-herzprobleme-erkennen/welcher-puls-ist-normal ↩
- Edward F. Coyle and José González-Alonso, ‘Cardiovascular drift during prolonged exercise: new perspectives’, Exercise and Sport Sciences Reviews, 2001, 29(2), pp. 88-92, accessed 1 November 2026. pubmed.ncbi.nlm.nih.gov https://pubmed.ncbi.nlm.nih.gov/11337829/ ↩

Campervans, motorhomes, cycling and calculators
Julien de Jurquet writes for Outfarer about campervans, motorhomes, cycling and calculators. He reads instruction manuals to the very end and never lets a figure through without its unit, so that your choices rest on sums rather than promises.

 Nolwenn Bastide

