 Français (France)
 English (UK)
 English (US)
 Deutsch (Deutschland)

Contents
What 200 W on the label really means
On the label: 200 W. On the roof of a van parked in Seattle in December: about 130 Wh a day on average, the equivalent of 40 minutes at full power. That’s what PVWatts, the solar calculator from the National Laboratory of the Rockies [7], works out for a 200 W panel lying flat. The same panel, in the same spot, produces about 930 Wh a day in June. Nearly seven times as much, without a single digit changing on the spec sheet.
The number on the label isn’t wrong. It’s a power rating measured under standard test conditions: 1,000 W of solar radiation per square meter of panel (about 93 W per square foot), at 77 °F (25 °C) [2]. It tells you how fast the panel produces in full sun, not how much it produces in a day. And it’s the second number that sizes a system: watt-hours per day, month by month, wherever you travel.
So this guide works in three steps: what each watt of panel produces depending on the month and the latitude; the wattage that covers your power use; then the battery, which bridges the gap between sunny days and gray ones. Your consumption itself is worked out appliance by appliance, as our house battery guide explains.
What a panel lying flat produces, month by month
We ran PVWatts V8 through its programming interface [7] for five cities, from Phoenix to Seattle. PVWatts comes from the National Laboratory of the Rockies (NLR), the U.S. Department of Energy lab known as NREL until December 2025 [8]. The settings: a 200 W panel lying flat, in other words tilted at 0°; open-rack mounting, with air behind it; and 14% losses, the default that PVGIS, the European Commission’s equivalent tool, suggests for cables, electronics, dirt, and module aging [2], a figure designed for grid-tied systems that we kept as is for a van. PVWatts uses typical-year weather data from the NLR’s National Solar Radiation Database [7]. Lying flat, the van’s orientation doesn’t matter: the panel faces the sky, not the south.
| City | December | March | June | September |
|---|---|---|---|---|
| Phoenix (33° N) | 530 | 910 | 1,280 | 930 |
| Denver (40° N) | 390 | 830 | 1,150 | 850 |
| Boston (42° N) | 250 | 700 | 920 | 710 |
| Minneapolis (45° N) | 220 | 720 | 990 | 700 |
| Seattle (48° N) | 130 | 460 | 930 | 600 |
PVWatts V8, typical-year NSRDB weather data; panel lying flat, open rack, 14% losses. To estimate 300 W or 400 W, multiply by 1.5 or 2: in PVGIS, output is exactly proportional to wattage.
Two things stand out. In June, latitude matters less than you’d think: from Boston to Seattle, a 200 W panel delivers 920 to 990 Wh a day, and Phoenix tops out around 1,280 Wh. In December, the gap opens up, and the farther north you go, the wider it gets: between June and December, output is divided by 2.4 in Phoenix, 3.7 in Boston, and nearly 7 in Seattle.
Geometry explains most of it. At solar noon on December 21, the sun climbs only 33° above the horizon in Phoenix, 24° in Boston, and 19° in Seattle: its rays hit a panel lying flat at a grazing angle, and the days are short. The typical-year data behind PVWatts also reflect the clouds actually observed by satellite.
200, 300, or 400 W: the wattage that covers your power use
The sample budget in our house battery guide covers two people, a compressor cooler, lighting, a laptop, and two phones: about 495 Wh a day in summer, and 891 Wh in winter with a diesel air heater. That leaves finding the panel wattage that produces as much, month after month.
Let’s do the math for Seattle. In June, 1 W of panel lying flat produces 4.6 Wh a day there: 495 divided by 4.6 gives about 110 W. In September, 3 Wh per watt: 160 W. In December, 0.67 Wh per watt: you’d need 740 W, nearly four times the panel on the label.
| City | December | March | June | September |
|---|---|---|---|---|
| Phoenix | 190 | 110 | 80 | 110 |
| Denver | 250 | 120 | 90 | 120 |
| Boston | 390 | 140 | 110 | 140 |
| Minneapolis | 440 | 140 | 100 | 140 |
| Seattle | 740 | 210 | 110 | 160 |
Calculation: 495 Wh divided by the output of 1 W of panel, according to PVWatts V8 (same assumptions as the previous table). A monthly average: gray days ask for more, hence the battery.
From April to August, 200 W covers the example’s 495 Wh a day on average in all five cities. With 300 W, the season stretches from March through October everywhere. In Phoenix and Denver, the numbers stay friendly all year: in December, 200 W covers the average in Phoenix, and 300 W in Denver.
In winter up north, the math is unforgiving. With the heater on, the example’s consumption climbs to 891 Wh a day: in December, you’d need about 340 W of panels in Phoenix, 710 W in Boston, and 1,300 W in Seattle. With standard modules, those 1,300 W would take up about 62 sq ft (5.7 m²) [4]. Charging while driving or from shore power then does most of the work, and solar only slows the drain. Our guide to camper vans in winter breaks down what a warm night costs, and how a sleeping bag rated for the right temperature lets you turn the heater down.
The battery, a buffer between sunny days and gray ones
A monthly average hides whole weeks of overcast skies. That’s the battery’s job: storing the surplus from the good days to get you through the gray ones. For this, PVGIS, the European Commission’s solar tool, which also covers North America [1], offers an off-grid calculator: it replays every year of data hour by hour, with the battery and consumption you give it, and counts the days when the battery reaches its The state of charge the battery isn’t run below, to protect it: 20% here, meaning 80% of the capacity gets used. [2].
We ran it for the same five cities with the example’s battery and consumption: 100 Ah of lithium at 12 V, or 1,200 Wh, cut off at 20% as PVGIS suggests for lithium, and 495 Wh used every day, mostly in the evening [2]. For these cities, PVGIS 5.3 uses ERA5 reanalysis rather than satellite data [2]. The tool also errs on the side of caution: it assumes an overall performance ratio of 0.67, battery included [2], versus 14% losses in the first calculation.
In June, 200 W is plenty: the battery hits its limit on only 0 to 3% of days, depending on the city. In spring and fall, every extra 100 W counts. In Seattle in March, the battery reaches its limit on 62% of days with 200 W, 16% with 300 W, and 4% with 400 W; in October, 75%, 33%, and 11%. In December, nothing helps in Seattle: 100% of days, even with 400 W. In Phoenix, 300 W keeps the battery off its limit almost every day, December included.
The flip side shows up in summer: more panels also means more energy wasted once the battery is full. In Phoenix, with 400 W, PVGIS counts about 1,800 Wh a day in June that neither the battery nor your appliances can absorb. Extra watts only help in the months when output falls short.
Heat, tilt, and shade: what changes output on a van
Panels heat up, and a hot panel produces less. According to PVGIS, modules with no air behind them can run up to 27 °F (15 °C) hotter in full sun [2]. The tool knows nothing about vans: the closest case to a flexible panel glued straight onto the roof is its “building-integrated” mounting. With that setting, output drops about 5% in July in Phoenix and about 4% in Seattle. Real, but modest next to the gap between June and December.
Tilting the panel changes more. Raised to 60° facing south, the same panel would produce 2 to 2.8 times as much in December, according to PVGIS, but 23 to 41% less in June: lying flat, a panel is set up for summer. And even tilted, 200 W would give only about 310 Wh a day in Seattle in December, well short of the example’s 495 Wh.
| City | No air behind, in July | Tilted at 60°, in December | Tilted at 60°, in June |
|---|---|---|---|
| Phoenix | -5% | × 2 | -41% |
| Denver | -4% | × 2.4 | -31% |
| Boston | -4% | × 2.5 | -27% |
| Minneapolis | -4% | × 2.5 | -25% |
| Seattle | -4% | × 2.8 | -23% |
PVGIS 5.3, ERA5 data, 2005-2023 averages, 14% losses. “No air behind”: PVGIS’s building-integrated mounting, our stand-in for a flexible panel glued to the roof. Tilted: facing south.
That leaves the losses the tools can’t see. PVGIS accounts for terrain blocking the horizon [3], but not for the tree, the building, or the neighboring RV shading your campsite. It lumps dirt, and sometimes snow, into its general losses [2]. Parked in the shade of a stand of trees, a panel will produce less than these tables, which assume a sky with no nearby obstacles.
Before installing: space, weight, and the installer
Space first. Crystalline silicon modules from the ten largest manufacturers averaged 22.7% efficiency at the end of 2024, ranging from 18.9 to 24.8% depending on the model [4]. Under the 1,000 W per square meter of the test conditions, 200 W takes up about 9 to 11 sq ft (0.8 to 1.1 m²), and 400 W about 17 to 23 sq ft (1.6 to 2.1 m²). Those figures apply to large modules: check the efficiency on your own panel’s spec sheet, then measure the open space between the roof vent, the fan, and the roof rack.
Weight next: panels, brackets, and cables add to the vehicle’s weight and eat into its payload, the margin between its curb weight and its gross vehicle weight rating (GVWR). Keep an eye on it if your van is already loaded close to that limit.
A solar panel is sized for the darkest month of your travels: divide what you use each day by what 1 W of panel produces that month, wherever you’re headed.
Gear related to this article
No affiliation: no commission, no sponsored products.
 Victron Energy
Victron SmartSolar MPPT 100/20
A 20 A MPPT solar charge controller for 290 W of panels on a 12 V system, with Bluetooth and a 30-day history: a way to check your output against PVGIS.
View on Amazon (opens in a new tab) Victron Energy
Victron SmartShunt 500 A
A shunt battery monitor that shows current, amp-hours used, and state of charge on your phone, so your daily energy budget is measured rather than estimated.
View on Amazon (opens in a new tab)
Worth watching
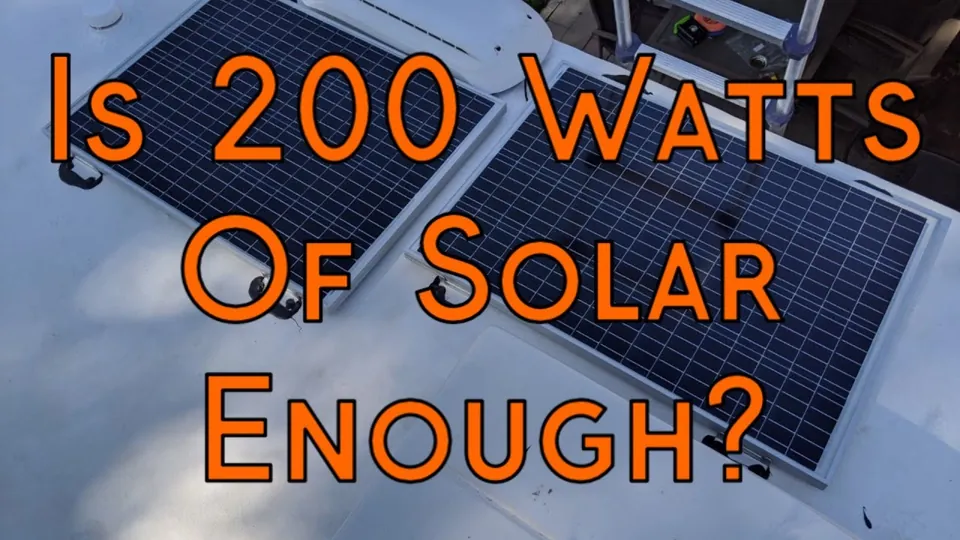
A 200-watt rooftop setup shown in use while boondocking, with the factors that decide whether it’s enough and a way to check it against your own power use: the real-world side of this guide’s question.
The video is hosted by YouTube (Google): nothing loads until you play it, and Google may then set cookies.
FAQ
How many watts of solar do you need for a van?
It depends on the month and where you are. For the example in our house battery guide, about 495 Wh a day, 200 W lying flat covers the average from April to August in all five cities we checked, from Phoenix to Seattle, according to PVWatts. Allow 300 W for March through October. In December, needs range from 190 W in Phoenix to 740 W in Seattle.
How much does a 200 W solar panel produce per day?
Lying flat on a van, about 920 to 1,280 Wh a day in June, from Boston to Phoenix, according to PVWatts typical-year data, with 14% losses. In March, 460 to 910 Wh; in December, 130 to 530 Wh. For 400 W, double these figures: in PVGIS, output is proportional to wattage.
How long does it take a 200 W panel to charge a 100 Ah battery?
A 100 Ah lithium battery at 12 V, used to 80%, stores about 960 Wh of usable energy. With nothing running, a 200 W panel lying flat produces that in about a day in June in Seattle, but in about seven days in December. In Phoenix, it takes less than a day in June and under two days in December, according to PVWatts.
Is a solar panel enough for van life in winter?
Not up north. In December, a 200 W panel lying flat averages 130 Wh a day in Seattle and 530 Wh in Phoenix, according to PVWatts. With a diesel heater, our example uses 891 Wh a day: you’d need 1,300 W of panels in Seattle, but only about 340 W in Phoenix. In northern winters, charging comes mostly from driving or shore power.
Should you tilt the solar panel on a van?
Lying flat, a panel is set up for summer, and the van’s orientation no longer matters. Raised to 60° facing south, it would produce 2 to 2.8 times as much in December, from Phoenix to Seattle, but 23 to 41% less in June, according to PVGIS. Even tilted, a 200 W panel stays far from covering winter in Seattle.
Sources
- European Commission, JRC, Photovoltaic Geographical Information System (PVGIS), overview page, production version 5.3, updated May 19, 2026, accessed October 24, 2026. joint-research-centre.ec.europa.eu https://joint-research-centre.ec.europa.eu/photovoltaic-geographical-information-system-pvgis_en ↩
- European Commission, JRC, PVGIS 5 user manual, updated June 24, 2026, accessed October 24, 2026. joint-research-centre.ec.europa.eu https://joint-research-centre.ec.europa.eu/photovoltaic-geographical-information-system-pvgis/using-pvgis-5/pvgis-5-user-manual_en ↩
- European Commission, JRC, API non-interactive service, PVGIS programming interface documentation, updated April 30, 2026, accessed October 24, 2026. joint-research-centre.ec.europa.eu https://joint-research-centre.ec.europa.eu/photovoltaic-geographical-information-system-pvgis/using-pvgis-5/api-non-interactive-service_en ↩
- Fraunhofer ISE, Photovoltaics Report, July 14, 2026, accessed October 24, 2026. ise.fraunhofer.de https://www.ise.fraunhofer.de/content/dam/ise/de/documents/publications/studies/Photovoltaics-Report.pdf ↩
- Government of Ontario, Ministry of Labour, Immigration, Training and Skills Development, Alert: Photovoltaic systems, published January 14, 2022, updated September 15, 2026, accessed October 24, 2026. ontario.ca https://www.ontario.ca/page/alert-photovoltaic-systems ↩
- INRS (French national research and safety institute for occupational risks), Installations photovoltaïques. Les risques professionnels, updated September 16, 2025 (in French), accessed October 24, 2026. inrs.fr https://www.inrs.fr/metiers/Energie/Installations-photovoltaiques/Installations-photovolta-ques-risques.html ↩
- National Laboratory of the Rockies (NLR), PVWatts V8 API, developer documentation, accessed October 24, 2026. developer.nlr.gov https://developer.nlr.gov/docs/solar/pvwatts/v8/ ↩
- National Laboratory of the Rockies (NLR), History, last updated April 28, 2026, accessed October 24, 2026. nlr.gov https://www.nlr.gov/about/history ↩

Vans, RVs, biking and calculators
Julien de Jurquet writes for Outfarer about camper vans, RVs, biking, and calculators. He reads manuals cover to cover and never lets a number slide without its unit, so your choices rest on math, not promises.


