 Français (France)
 English (UK)
 English (US)
 Deutsch (Deutschland)

Contents
At the col, the wind tugs at the map, the path splits three ways, and the fingerpost went missing long ago. Whoever can read the thin brown lines already knows which of the three drops into the right glen. Whoever can’t gets out their phone, and looks at the battery.
Reading a map takes neither a gift nor a qualification: a few conventions, always the same ones, and a bit of practice. This guide takes them in the order you use them. To find your way with a compass, see our guide to the compass; to plan your line, the one on routes and GPX files.
Which map for walking in Britain
Two Ordnance Survey series do most of the work. OS Explorer maps, at 1:25,000, show many features, paths and buildings included, over a small area; OS Landranger maps, at 1:50,000, show roads, larger paths and some individual features [1]. In Scotland, Mountaineering Scotland notes that these two scales are the most common for walkers, alongside Harvey’s 1:40,000 [2]. The map publisher Harvey makes its Superwalker maps at 1:25,000 and its British Mountain Map, Ultramap and National Trail maps at 1:40,000, all waterproof, tearproof and carrying the National Grid [3].
The larger scale shows more: on a 1:25,000 map, contours are more detailed, and boulders, small rock features, lochans and small streams appear, but each sheet covers less ground [2]. On screen, the OS Maps app and website let you switch between the Explorer and Landranger scales with a Premium subscription [1]; our comparison of walking apps says which ones work offline.
Scale: 4 cm to 1 km
Scale tells you how many times the ground has been shrunk. At 1:25,000, 1 cm on the map stands for 25,000 cm on the ground, or 250 m; the front of an Explorer map spells it out as ‘4cm to 1km’, and the grid lines are exactly 4 cm apart, so every square is 1 km by 1 km [1]. On a 1:50,000 Landranger, 1 cm is 500 m, and 2 cm make 1 km [2].
| Scale | 1 cm on the map | 1 km on the ground | Typical map |
|---|---|---|---|
| 1:25,000 | 250 m | 4 cm | OS Explorer, Harvey Superwalker: paths and relief in detail |
| 1:40,000 | 400 m | 2.5 cm | Harvey British Mountain Map, Ultramap, National Trail |
| 1:50,000 | 500 m | 2 cm | OS Landranger: the bigger picture, long-distance walks |
Our calculation, from the definition of scale; benchmarks from Ordnance Survey, Mountaineering Scotland and Harvey. [1, 2, 3]
To measure a winding path, the OS suggests a piece of string, your compass lanyard or a spare shoelace laid along the route, then held against the scale bar; a romer, a ruler marked for a given scale, saves the conversion [4]. With a ruler, multiply by the scale: 8.5 cm on an Explorer map make 2.125 km, and the shortcut is to quarter the centimetres at 1:25,000, or halve them at 1:50,000 [4]. Bear in mind too that on hilly or mountainous ground, the distance you actually walk is always longer than the one measured flat on the map, as the French walking federation points out [5]. Our guide to estimating walking time then turns those kilometres into hours.
Contour lines: the hills, laid flat
A a line drawn between points of equal height, so it stays at the same height all the way along is the key to any topographic map, as the Ordnance Survey defines it [6]. The OS suggests picturing the tide lines the sea would leave behind as it drained away, one every 10 m [6]: seen from above, each one draws a contour.
The height difference between two neighbouring lines is the the constant difference in height between two neighbouring contour lines, given in the map key. Here the OS contradicts itself: one of its guides says normally 10 m, or 5 m in flatter areas [6]; another, usually 5 m at 1:25,000, or 10 m in mountainous regions [7]. The key settles it: 5 m and/or 10 m on Explorer maps [8], 10 m on Landranger maps [9], which Mountaineering Scotland confirms [2]. Harvey uses 15 m [10]: change publisher and you change the count. On the OS example, the bolder, numbered lines fall every 50 m, with four lighter ones in between [6]; on Harvey’s 1:40,000 maps, these index contours fall every 75 m [11]. The numbers are printed facing uphill [7, 2]: without even reading them, their direction tells you which way is up. Heights are measured from mean sea level at Newlyn, in Cornwall [9].
Reading the ground: slope, valley, spur, col
A handful of shapes is enough to read almost any landscape.
- The slope: the closer together the contours, the steeper the slope; on a very steep hill they may even merge [6].
- The summit: ring contours, closed and nested inside one another, mark knolls and hills [2].
- The valley and the spur: the contours draw a V. If the V points uphill, it’s a valley; if it points downhill, it’s a spur, a hill that juts out [6]. Streams usually run at the bottom of valleys, not on ridges: a blue line settles the question [6].
- The col: contours bunched on either side of lower, more evenly spaced ones show a valley or col between two areas of high ground [6]; Mountaineering Scotland lists cols, saddles and bealachs as one feature [2].
Contours also help you plan. On rough or mountainous ground, the OS suggests ‘contouring’: once you’ve reached easy-going height, you walk along the slope at a constant altitude, avoiding energy-sapping ups and downs and keeping track of your position more easily [6].
Working out a gradient from the map
The OS method takes three steps: measure the distance on the map with a ruler or romer and convert it with the scale, work out the height change by subtracting the lowest contour from the highest, then divide height by distance [6]. Take an example at 1:25,000 with a 10 m interval: you cross 5 contours, or 50 m of ascent, over 1 cm of map, or 250 m. The gradient is 50 divided by 250, or 20%.
The OS gives its own benchmark: a 1 m climb for 10 m travelled is a 10% slope, or 1 in 10, about 5.7°. As a rule of thumb, over 15% is steep for cars and road cycling, and over 25% is a tough walk in either direction; and the slope is never quite constant, so some parts will be far steeper than others [6]. These percentages sit alongside the grading of mountain walks, which tells you how hard a route is.
Grid references: along the corridor, then up the stairs
OS maps are covered by a series of blue grid lines, the National Grid. The vertical lines are eastings, because their numbers increase as you travel east; the horizontal lines are northings, increasing northwards. Great Britain is divided into 100 km squares, each identified by two letters, and the map grid is further divided into 1 km squares [12]. Within each 100 km block, the lines are numbered from 00 to 99 [2].
- A 4-figure reference names a square. Go along the eastings to the bottom left-hand corner of the square and note its two figures, then up the northings to the same corner: 6233, for example. Easting first, or as the OS puts it, along the corridor before you go up the stairs [12].
- A 6-figure reference names a point. Imagine the square divided into 10 parts along each side, and add the extra tenth to each pair: 625 333 [12]. It’s standard practice, says Mountaineering Scotland, because it identifies a square of 100 m by 100 m; the romer on your compass makes it more precise than judging by eye [2].
- Add the letters and a landmark. The OS example reads ‘SZ 644 874, at the crossroads’, on the Bembridge Explorer map [12].
Over the border, or across the Channel, the grid changes, and so does the way the map is oriented. The details, magnetic variation included, are in our guide to the compass.
Colours and symbols: read the key first
The colours follow an almost universal code, with each publisher’s own variations. On British maps:
| Colour or mark | What it shows |
|---|---|
| Brown lines | Contours, on OS and Harvey maps |
| Blue grid | The National Grid lines on OS maps, 1 km apart |
| Grey contours | Mostly exposed rock, on Harvey maps |
| Green, pale yellow, no colour | Forest, farmland, and open, higher ground, on Harvey maps |
| Short black wavy lines | Rock outcrops on OS maps, their ends pointing up the slope |
From Ordnance Survey, Mountaineering Scotland and Harvey. [7, 2, 12, 10, 11]
The key printed on the map explains every symbol. On the Explorer key, version 2022-09, the natural features include loose rock, outcrop, vertical face or cliff, boulders and scree, the vegetation tells coniferous from non-coniferous trees and bracken, heath or rough grassland, and accommodation runs from youth hostels to bunkhouses and camping barns [8]. Landranger maps use some different symbols [17]. Read the key at least once before setting off, especially on a map from another country. On French IGN maps, contours are orange, cliffs black, and waymarked walking routes generally red [5]; in the United States, contours are brown, important roads and land grids red, and purple once marked revisions [18].
How old is your map? A path may have moved
A map ages. A man-made feature, such as a log cabin, can be added to the landscape or removed from it, while natural features change more slowly, which is why the OS recommends navigating by them [6]; even trees and water can change size and shape over time [13]. Harvey, for its part, says its maps are field checked by its surveyors [10]. Between two editions, a path can be diverted, a forest felled, a footbridge washed away: look for the date of the edition before trusting a sheet from the bottom of the drawer.
Across the Channel, the French walking federation reports that the IGN’s 1:25,000 TOP Rando 25 maps are reissued every 6 to 10 years on average, more often in tourist areas or where the landscape changes fast; in 2025, the IGN carried out a large update campaign in Corsica [19].
A good habit to get into, before the map goes into your rucksack: read its margin. The scale, the contour interval, the key and the date of the edition fit into a few lines, and they’re worth every app in the world on the day the battery gives up.
Kit related to this article
No affiliation: no commission, no sponsored products.
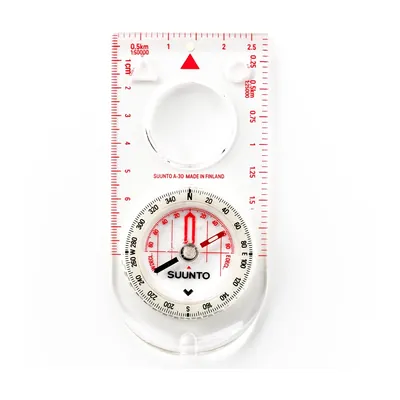
Suunto A-30 NH
A 32 g baseplate compass with a magnifier, luminous markings and 1:25,000 and 1:50,000 scales: for going back to the map when the waymarks run out.
View on Amazon (opens in a new tab)
Worth watching
In just over a minute, Ordnance Survey and naturalist Steve Backshall explain how the contour lines on an OS map show the height and shape of the land.
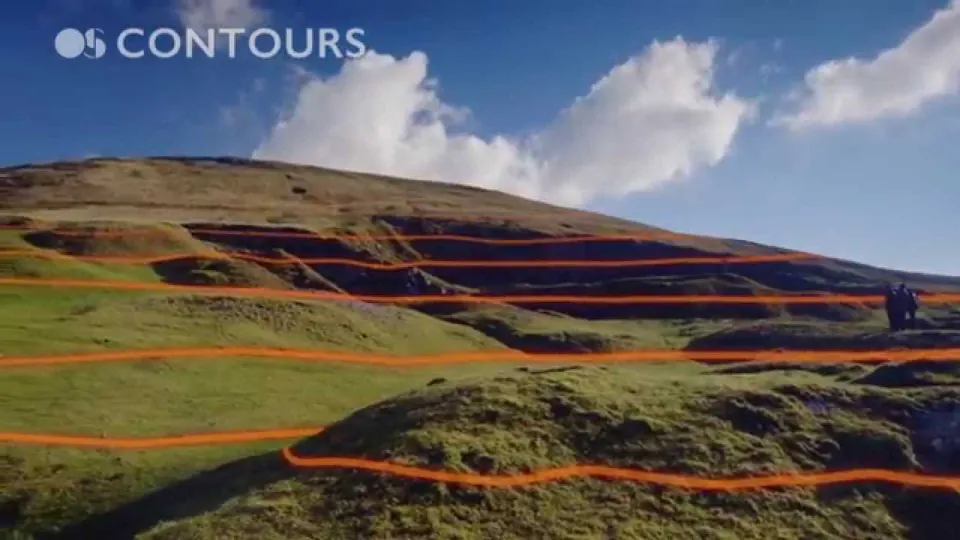
The video is hosted by YouTube (Google): nothing loads until you play it, and Google may then set cookies.
FAQs
What does 1:25,000 mean on an OS map?
It means the ground has been shrunk 25,000 times: 1 cm on the map stands for 25,000 cm, or 250 m, on the ground, and 4 cm make 1 km. On OS Explorer maps, the grid lines are exactly 4 cm apart, so each square is 1 km by 1 km. It’s the scale of OS Explorer and Harvey Superwalker maps, detailed enough to show paths and relief.
What is the contour interval on OS maps?
It’s the constant height difference between two neighbouring contour lines. On OS Explorer maps at 1:25,000, the key gives 5 m and/or 10 m depending on the area; on OS Landranger maps at 1:50,000, it’s 10 m. Harvey maps use 15 m. The bolder, numbered lines are index contours: on the OS example with 10 m contours, they fall every 50 m.
How do you tell a valley from a spur on a map?
The contour lines draw a V. If the point of the V faces uphill, it’s a valley; if it faces downhill, it’s a spur or a ridge. A stream drawn in blue confirms the valley, since water runs at the bottom. The contour numbers help too: on OS maps, they are printed facing uphill.
How do you give a six-figure grid reference?
Find the bottom left-hand corner of your square: read the easting first, along the corridor, then the northing, up the stairs, for a four-figure reference such as 6233. Then divide the square into tenths each way and add the extra figure to each pair: 625 333. Add the two letters of the 100 km square, such as SZ, and a nearby landmark.
How do you work out a gradient from an OS map?
Divide the height gained by the horizontal distance measured on the map, then multiply by 100. At 1:25,000 with contours every 10 m, five contours crossed over 1 cm of map make 50 m of ascent over 250 m: a 20% gradient. For the OS, a 1 m climb for 10 m travelled is 10%, and anything over 25% is a tough walk.
Sources
- Ordnance Survey, Jonathan Elder, ‘A Beginner’s Guide to Understanding Map Scales’, OS Maps, 29 May 2022, accessed 14 November 2026. osmaps.com https://osmaps.com/discover/guides/understanding-map-scales/ ↩
- Mountaineering Scotland, ‘The map and how to use it’, navigation advice, accessed 14 November 2026. mountaineering.scot https://www.mountaineering.scot/safety-and-skills/essential-skills/navigation/the-map-and-how-to-use-it ↩
- Harvey, ‘Which map’, product specification table, accessed 14 November 2026. harveymaps.co.uk https://www.harveymaps.co.uk/acatalog/Which-Map.html ↩
- Ordnance Survey, Jonathan Elder, ‘A Beginner’s Guide to Measuring Distance on a Map’, OS Maps, 15 May 2022, accessed 14 November 2026. osmaps.com https://osmaps.com/discover/guides/beginners-guide-to-measuring-distance-on-a-map/ ↩
- Fédération française de la randonnée pédestre (FFRandonnée, the French walking federation), ‘Comprendre les cartes topographiques’ (understanding topographic maps), 2 October 2020 (in French), accessed 14 November 2026. ffrandonnee.fr https://www.ffrandonnee.fr/randonner/conseils/comprendre-les-cartes-topographiques ↩
- Ordnance Survey, Jonathan Elder, ‘Advanced guide to reading contours and relief’, OS Maps, 20 June 2022, accessed 14 November 2026. osmaps.com https://osmaps.com/discover/guides/advanced-contours-and-relief/ ↩
- Ordnance Survey, Jonathan Elder, ‘A Beginner’s Guide to Understanding Map Contour Lines’, OS Maps, 5 June 2022, accessed 14 November 2026. osmaps.com https://osmaps.com/discover/guides/understanding-map-contour-lines-for-beginners/ ↩
- Ordnance Survey, OS Explorer ‘Legend 1:25 000 scale’, version 2022-09, PDF, accessed 14 November 2026. ordnancesurvey.co.uk https://www.ordnancesurvey.co.uk/documents/Explorer-Generic-Legend-English-2022-09.pdf ↩
- Ordnance Survey, OS Landranger ‘Legend 1:50 000 scale’, version 2022-01, PDF, accessed 14 November 2026. ordnancesurvey.co.uk https://www.ordnancesurvey.co.uk/documents/product-support/support/50k-raster-legend.pdf ↩
- Harvey, ‘Why choose a HARVEY map’, accessed 14 November 2026. harveymaps.co.uk https://harveymaps.co.uk/acatalog/Why-a-HARVEY-map-1.html ↩
- Harvey, Nigel Williams, ‘Steep terrain and contours’, navigation blog, accessed 14 November 2026. harveymaps.co.uk https://www.harveymaps.co.uk/acatalog/Steep-terrain-and-contours.html ↩
- Ordnance Survey, Jonathan Elder, ‘A Beginner’s Guide to Grid References’, OS Maps, 10 June 2022, accessed 14 November 2026. osmaps.com https://osmaps.com/discover/guides/beginners-guide-to-grid-references/ ↩
- Ordnance Survey, Jonathan Elder, ‘Advanced guide to finding your exact location’, OS Maps, 5 July 2022, accessed 14 November 2026. osmaps.com https://osmaps.com/discover/guides/navigation-pinpointing-your-location/ ↩
- IGN (French national mapping agency), ‘S’orienter très précisément avec une boussole et une carte IGN’ (finding your way precisely with a compass and an IGN map), tutorial, PDF (in French), accessed 14 November 2026. ign.fr https://www.ign.fr/publications-de-l-ign/institut/Ressources_pedagogiques/orientation/tuto_boussole_precision.pdf ↩
- Fédération française de la randonnée pédestre (FFRandonnée), ‘Le Géoportail rejoint cartes.gouv.fr’ (the Géoportail joins cartes.gouv.fr), 4 July 2026 (in French), accessed 14 November 2026. ffrandonnee.fr https://www.ffrandonnee.fr/s-informer/actualites/le-geoportail-rejoint-cartes-gouv-fr ↩
- swisstopo, ‘Landeskarten der Schweiz’, map key, 2024, PDF (in German), accessed 14 November 2026. api3.geo.admin.ch https://api3.geo.admin.ch/static/images/legends/ch.swisstopo.landeskarte-farbe-10_de_big.pdf ↩
- Ordnance Survey, OS Maps Discover Team, ‘A Beginner’s Guide to OS Map Symbols’, OS Maps, 28 June 2022, accessed 14 November 2026. osmaps.com https://osmaps.com/discover/guides/beginners-guide-to-os-map-symbols/ ↩
- U.S. Geological Survey, ‘Topographic Map Symbols’, brochure, PDF, accessed 14 November 2026. pubs.usgs.gov https://pubs.usgs.gov/gip/TopographicMapSymbols/topomapsymbols.pdf ↩
- Fédération française de la randonnée pédestre (FFRandonnée), ‘Destination Corse avec les nouvelles cartes TOP 25 de l’IGN’ (the IGN’s new TOP 25 maps of Corsica), 30 April 2026 (in French), accessed 14 November 2026. ffrandonnee.fr https://www.ffrandonnee.fr/s-informer/actualites/destination-corse-avec-les-nouvelles-cartes-top-25-de-l-ign ↩

Camping, wild camping, bushcraft and hiking
Guillaume Hoarau writes for Outfarer about camping, wild camping, bushcraft and hiking. A survival-skills enthusiast and a collector of old field manuals, he likes clear explanations, lists that earn their place and other people’s stories, which he tells well.


 Julien de Jurquet