 Français (France)
 English (UK)
 English (US)
 Deutsch (Deutschland)

Contents
At the saddle, the wind tugs at the paper, the trail splits three ways, and the sign rotted off years ago. If you can read the thin brown lines, you already know which fork drops into the right drainage. If you can’t, out comes the phone, and you check the battery.
Reading a topographic map takes no special talent and no diploma: a handful of conventions, always the same, and a little practice. This guide takes them in the order you’ll use them. To navigate with a compass, see our compass guide; to plan your route, see our guide to route planning and GPX files.
Which map for hiking in the US
The classic hiking map in the United States is the USGS 7.5-minute quadrangle, at 1:24,000, the scale used for most US topographic mapping. Each quad covers 7.5 minutes of latitude by 7.5 minutes of longitude, and coverage is complete for most of the country, except Puerto Rico and most of Alaska, mapped at 1:63,360. At this scale, the map shows footbridges, fence lines, and most campgrounds [1].
The paper quads the USGS printed from 1947 to 2006 now live on as US Topo maps, with the same extent, scale, and layout. They’re geospatial PDFs, freely available for download, that you can print at 1:24,000 [2]. Our hiking app comparison covers the apps that show them offline. And a paper map still earns its place: Isle Royale National Park lists a topographic map and a compass among the essential gear for its backpackers [3].
Scale: 1 inch for 2,000 feet
The scale tells you how many times the ground has been shrunk. At 1:24,000, 1 inch on the map stands for 24,000 inches on the ground, or exactly 2,000 feet, and 1 centimeter for 240 meters [1]. A mile on the ground takes up 2.64 inches of map. At 1:63,360, 1 inch is exactly 1 mile; at 1:100,000, the map covers more ground with less detail, and 1 inch is 1.6 miles [1].
| Scale | 1 inch on the map | 1 mile on the ground | Typical use |
|---|---|---|---|
| 1:24,000 | 2,000 feet | 2.64 inches | Hiking: trails and terrain in detail |
| 1:63,360 | 1 mile | 1 inch | Most of Alaska |
| 1:100,000 | 1.6 miles | 0.63 inch | Overview, getting to the trailhead |
Inch values from the USGS; inches per mile are our calculation from the definition of scale. [1]
To measure a winding trail, France’s hiking federation suggests a strip of paper, a piece of yarn, or a ruler, adding a little extra when there are lots of switchbacks; and in hilly or mountainous terrain, the distance you actually walk is always longer than the flat distance measured on the map [4]. One trap is very American: the photocopied quad. A Bureau of Land Management map-reading course points out that a reduced copy still says 1:24,000 on it, but isn’t 1:24,000 anymore, so the first thing to do with any map is verify the scale [5]. Our guide to estimating hiking time then turns those miles into hours.
Contour lines: the terrain, flattened
A an imaginary line that joins points of equal elevation above a reference surface, such as mean sea level is the key to any topographic map, as the US Geological Survey (USGS) defines it; since each one marks a single elevation, contours never cross [6]. Picture a mountain sliced into horizontal layers of equal thickness: seen from a plane, the edge of each slice traces a contour.
The elevation difference between two neighboring contours is the the constant difference in elevation between two adjacent contour lines on a map. It changes from map to map: a relatively flat area may have an interval of 10 feet or less, mountainous areas 100 feet or more, and the interval is printed in the margin of every USGS map [6]. To help you find elevations, the the wider contour lines that carry elevation values are drawn wider, with the elevation printed along them; the narrower intermediate contours fill in the detail [6]. On US Topo maps, elevations are referenced to the North American Vertical Datum of 1988 (NAVD 88) [2].
Reading terrain: slope, valley, spur, saddle
Four shapes are enough to read almost any landscape.
- The slope: contours very close together mean a steep slope; widely spaced contours, or none at all, mean the ground is relatively level [6].
- The summit: several closed contours nested inside one another, with the ground falling away on every side [7].
- The valley and the spur: here the contours draw a V. The BLM’s rule is simple: contours always V upstream [5]. If the V points uphill, it’s a valley; if it points downhill, it’s a spur, a ridge jutting out from the mountain, says Ordnance Survey, Britain’s mapping agency [8]. Streams run along valley bottoms, not along ridges: a blue line settles the question [8].
- The saddle: a low point between two neighboring hills [7]. On the map, two sets of closed contours face each other without meeting, and the pass lies between them, as the BLM course shows [5].
Working out a grade from the map
Grade in percent is the elevation gain divided by the horizontal distance measured on the map, times 100, as the Bavarian State Office for Digitization, Broadband and Surveying puts it [7]. Here’s an example at 1:24,000, with a 40-foot contour interval: you cross 5 contours, or 200 feet of elevation gain, over half an inch of map, or 1,000 feet. The grade is 200 divided by 1,000, or 20%.
The rule works in any unit. The Bavarian office’s own example is in meters: 240 m of elevation gain (787 ft) over 750 m measured on the map (2,460 ft) is a 32% grade, and the trail on the ground is actually 787.5 m long (2,580 ft) [7]. Those percentages are a good complement to hiking difficulty ratings, which describe how hard a route is.
Colors and symbols: read the legend first
Colors follow a code that’s nearly universal. On USGS maps:
| Color | What it shows |
|---|---|
| Brown | Topographic contours |
| Blue | Water: lakes, streams, irrigation ditches, and other hydrographic features |
| Green | Vegetation, such as woodland |
| Red | Land grids and important roads; on some maps, densely built-up areas |
| Black | Other roads and trails, railroads, boundaries, and other cultural features |
| Gray | Densely built-up areas |
| Purple | Old revisions: no longer used, but still on many existing maps |
From the USGS brochure “Topographic Map Symbols.” [6]
The USGS symbol sheet explains each sign, from trail and trailhead to spring or seep and campground [6]. Read the legend at least once before you head out, especially on a map from another country. In France, for example, contours are orange, cliffs are black, and marked hiking routes are usually overprinted in red [4].
Grids and coordinates
Every US Topo map carries a 1,000-meter UTM grid, drawn and labeled to the US National Grid standard, with a grid reference box in the margin [2]; on older quads, the UTM grid may appear only as ticks along the edges [6]. Declination, the angle between true north and magnetic north, is covered in our compass guide.
The red squares with numbers aren’t a coordinate grid. They’re the Public Land Survey System: townships of 6 by 6 miles, each divided into sections numbered 1 to 36, starting with section 1 in the upper right corner, and each section is roughly one square mile [5, 6]. Handy for finding a property line, less so for telling rescuers where you are: for that, your phone’s GPS coordinates are the simplest option, as our guide to calling for help without cell service explains. Abroad, maps have their own systems:
The map’s date: a trail may have moved
Maps age. On many existing USGS maps, purple still marks the features added in an old revision [6]. And those revisions weren’t always checked on foot: in the 1970s, 1980s, and 1990s, the BLM course explains, budget cuts led the USGS to update quads from new aerial photos, adding new streets and changes without sending anyone back into the field to look for that spring again [5]. Between two editions, a trail can be rerouted, a forest burned or logged, a footbridge washed out.
So check the date in the margin, and compare with a more recent source: current US Topo maps and older editions can both be downloaded [2], and our guide to route planning and GPX files explains how to check a trail against the land agency’s own information.
The smart move, before you slide the map into your pack: read the margin. Scale, contour interval, declination, and the survey date fit in a few lines, and on the day your battery dies, they’re worth more than every app in the world.
Gear related to this article
No affiliation: no commission, no sponsored products.
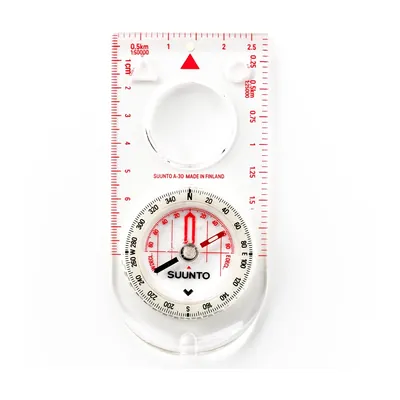
Suunto A-30 NH
A 1.1 oz baseplate compass with a magnifier and luminous markings, sold with metric or USGS map scales: for going back to the map when the blazes run out.
View on Amazon (opens in a new tab)
Worth watching
REI’s short guide to topographic maps: contour lines, contour intervals, and how to picture three-dimensional terrain from a flat sheet of paper.

The video is hosted by YouTube (Google): nothing loads until you play it, and Google may then set cookies.
FAQ
What does 1:24,000 mean on a topo map?
It means the ground has been shrunk 24,000 times: 1 inch on the map stands for 24,000 inches on the ground, exactly 2,000 feet, and a mile takes up 2.64 inches of map. It’s the scale of the USGS 7.5-minute quadrangles and today’s US Topo maps, detailed enough to show trails, footbridges, and most campgrounds.
What is the contour interval on a topographic map?
It’s the constant difference in elevation between two neighboring contour lines. On USGS maps, it’s chosen to suit the terrain: 10 feet or less in relatively flat areas, 100 feet or more in the mountains. It’s printed in the margin of every USGS map. The wider index contours carry the elevation values.
How do you tell a valley from a ridge on a topo map?
Look for the V the contour lines make. The BLM’s rule: contours always V upstream. If the point of the V aims uphill, you’re looking at a valley; if it aims downhill, it’s a spur or a ridge. A blue stream line confirms the valley, since water always runs along the bottom.
How do you calculate grade from a topographic map?
Divide the elevation gain by the horizontal distance measured on the map, then multiply by 100. At 1:24,000 with a 40-foot contour interval, for example, crossing five contours over half an inch of map means 200 feet of gain over 1,000 feet: a 20% grade.
Sources
- U.S. Geological Survey, “Map Scales,” Fact Sheet 015-02, February 2002, accessed November 14, 2026. pubs.usgs.gov https://pubs.usgs.gov/fs/2002/0015/report.pdf ↩
- U.S. Geological Survey, L. R. Davis et al., “US Topo Product Standard,” Techniques and Methods 11-B2, version 2.0, February 2019, accessed November 14, 2026. pubs.usgs.gov https://pubs.usgs.gov/tm/tm11b2/downloads/tm11b2_v2.pdf ↩
- National Park Service, Isle Royale National Park, “Packing Guide,” last updated September 25, 2026, accessed November 14, 2026. nps.gov https://www.nps.gov/isro/planyourvisit/packing-guide.htm ↩
- Fédération française de la randonnée pédestre (FFRandonnée, the French hiking federation), “Comprendre les cartes topographiques” (understanding topographic maps), October 2, 2020 (in French), accessed November 14, 2026. ffrandonnee.fr https://www.ffrandonnee.fr/randonner/conseils/comprendre-les-cartes-topographiques ↩
- Bureau of Land Management, National Training Center, “Basic Map Reading,” course study guide, July 2010, accessed November 14, 2026. ntc.blm.gov https://www.ntc.blm.gov/krc/uploads/1050/bmr_sg.pdf ↩
- U.S. Geological Survey, “Topographic Map Symbols,” brochure (PDF), accessed November 14, 2026. pubs.usgs.gov https://pubs.usgs.gov/gip/TopographicMapSymbols/topomapsymbols.pdf ↩
- Landesamt für Digitalisierung, Breitband und Vermessung (LDBV, Bavarian State Office for Digitization, Broadband and Surveying), “Tipps zum Kartenlesen” (map reading tips), leaflet, April 29, 2025 (PDF, in German), accessed November 14, 2026. ldbv.bayern.de https://www.ldbv.bayern.de/mam/ldbv/dateien/faltblatt_tipps_zum_kartenlesen.pdf ↩
- Ordnance Survey, Jonathan Elder, “Advanced guide to reading contours and relief,” OS Maps, June 20, 2022, accessed November 14, 2026. osmaps.com https://osmaps.com/discover/guides/advanced-contours-and-relief/ ↩
- IGN (France’s national mapping agency), “S’orienter très précisément avec une boussole et une carte IGN” (precise navigation with a compass and an IGN map), tutorial (PDF, in French), accessed November 14, 2026. ign.fr https://www.ign.fr/publications-de-l-ign/institut/Ressources_pedagogiques/orientation/tuto_boussole_precision.pdf ↩
- swisstopo, “Landeskarten der Schweiz” (national maps of Switzerland), legend, 2024 (PDF, in German), accessed November 14, 2026. api3.geo.admin.ch https://api3.geo.admin.ch/static/images/legends/ch.swisstopo.landeskarte-farbe-10_de_big.pdf ↩
- Ordnance Survey, “Beginner’s guide to grid references,” OS Maps, June 10, 2022, accessed November 14, 2026. osmaps.com https://osmaps.com/discover/guides/beginners-guide-to-grid-references/ ↩

Camping, backpacking, bushcraft and hiking
Guillaume Hoarau writes for Outfarer about camping, backpacking, bushcraft, and hiking. A survival-skills buff and a collector of vintage field manuals, he loves clear explanations, lists that actually help and other people’s stories, which he tells well.


 Julien de Jurquet